Prediction of Turbine Failure
Dr. Patrick Bangert
algorithmica technologies GmbH
In this study we will demonstrate that it is possible to predict a known turbine failure using historical data. On a particular turbine, a blade tore off and completely damaged the turbine, requiring extensive and expensive repair and replacement. After the event, the question was raised whether this failure could have been predicted and localized to a specific place inside the turbine.
The specific turbine in question has over 80 measurements on it that were considered worthwhile to monitor. Most of these were vibrations, but there were also some temperatures, pressures and electrical values. A history of six months was deemed long enough, and the frequency of measurement depended upon each individual measurement point – some were measured several times per second, others only once every few hours. In fact, the data historian stores a new value in its database only if the new value differs from the last stored value by a predefined parameter. In this way, the history matrix contained a realistic picture of an actual turbine instrumented with sensors as it is normally done in the industry. No enhancements were made to the turbine, its instrumentation or the data itself.
During the time leading up to the blade tear and until immediately before it, no sign of the imminent blade tear could be detected by any analysis run by the plant engineers either before or after the blade tear was known. Thus, it was concluded that the tear was a spontaneous and thus an unpredictable event.
The data that we were provided to create a model was deliberately cut off two days before the known (historically occurring) blade tear on that turbine in order for us to find out whether or not the event could have been predicted.
Initially, the machine learning algorithm was provided with no data. Then the points measured were presented to the algorithm one by one, starting with the first measured point. Slowly, the model learned more and more about the system, the predictions gradually became more accurate and the system was capable of making a prediction for longer and longer times into the future. Naturally, the time for which the algorithm can make predictions increases with additional data and experience. Once the last measured point was presented to the algorithm, it produced a predication valid for the following two days of real time. The result may be seen in figure 1. The actual blade tear that occurred 46 hours from the end of the available data was predicted to occur 48 into the future. Thus, this event is predictable two days in advance.
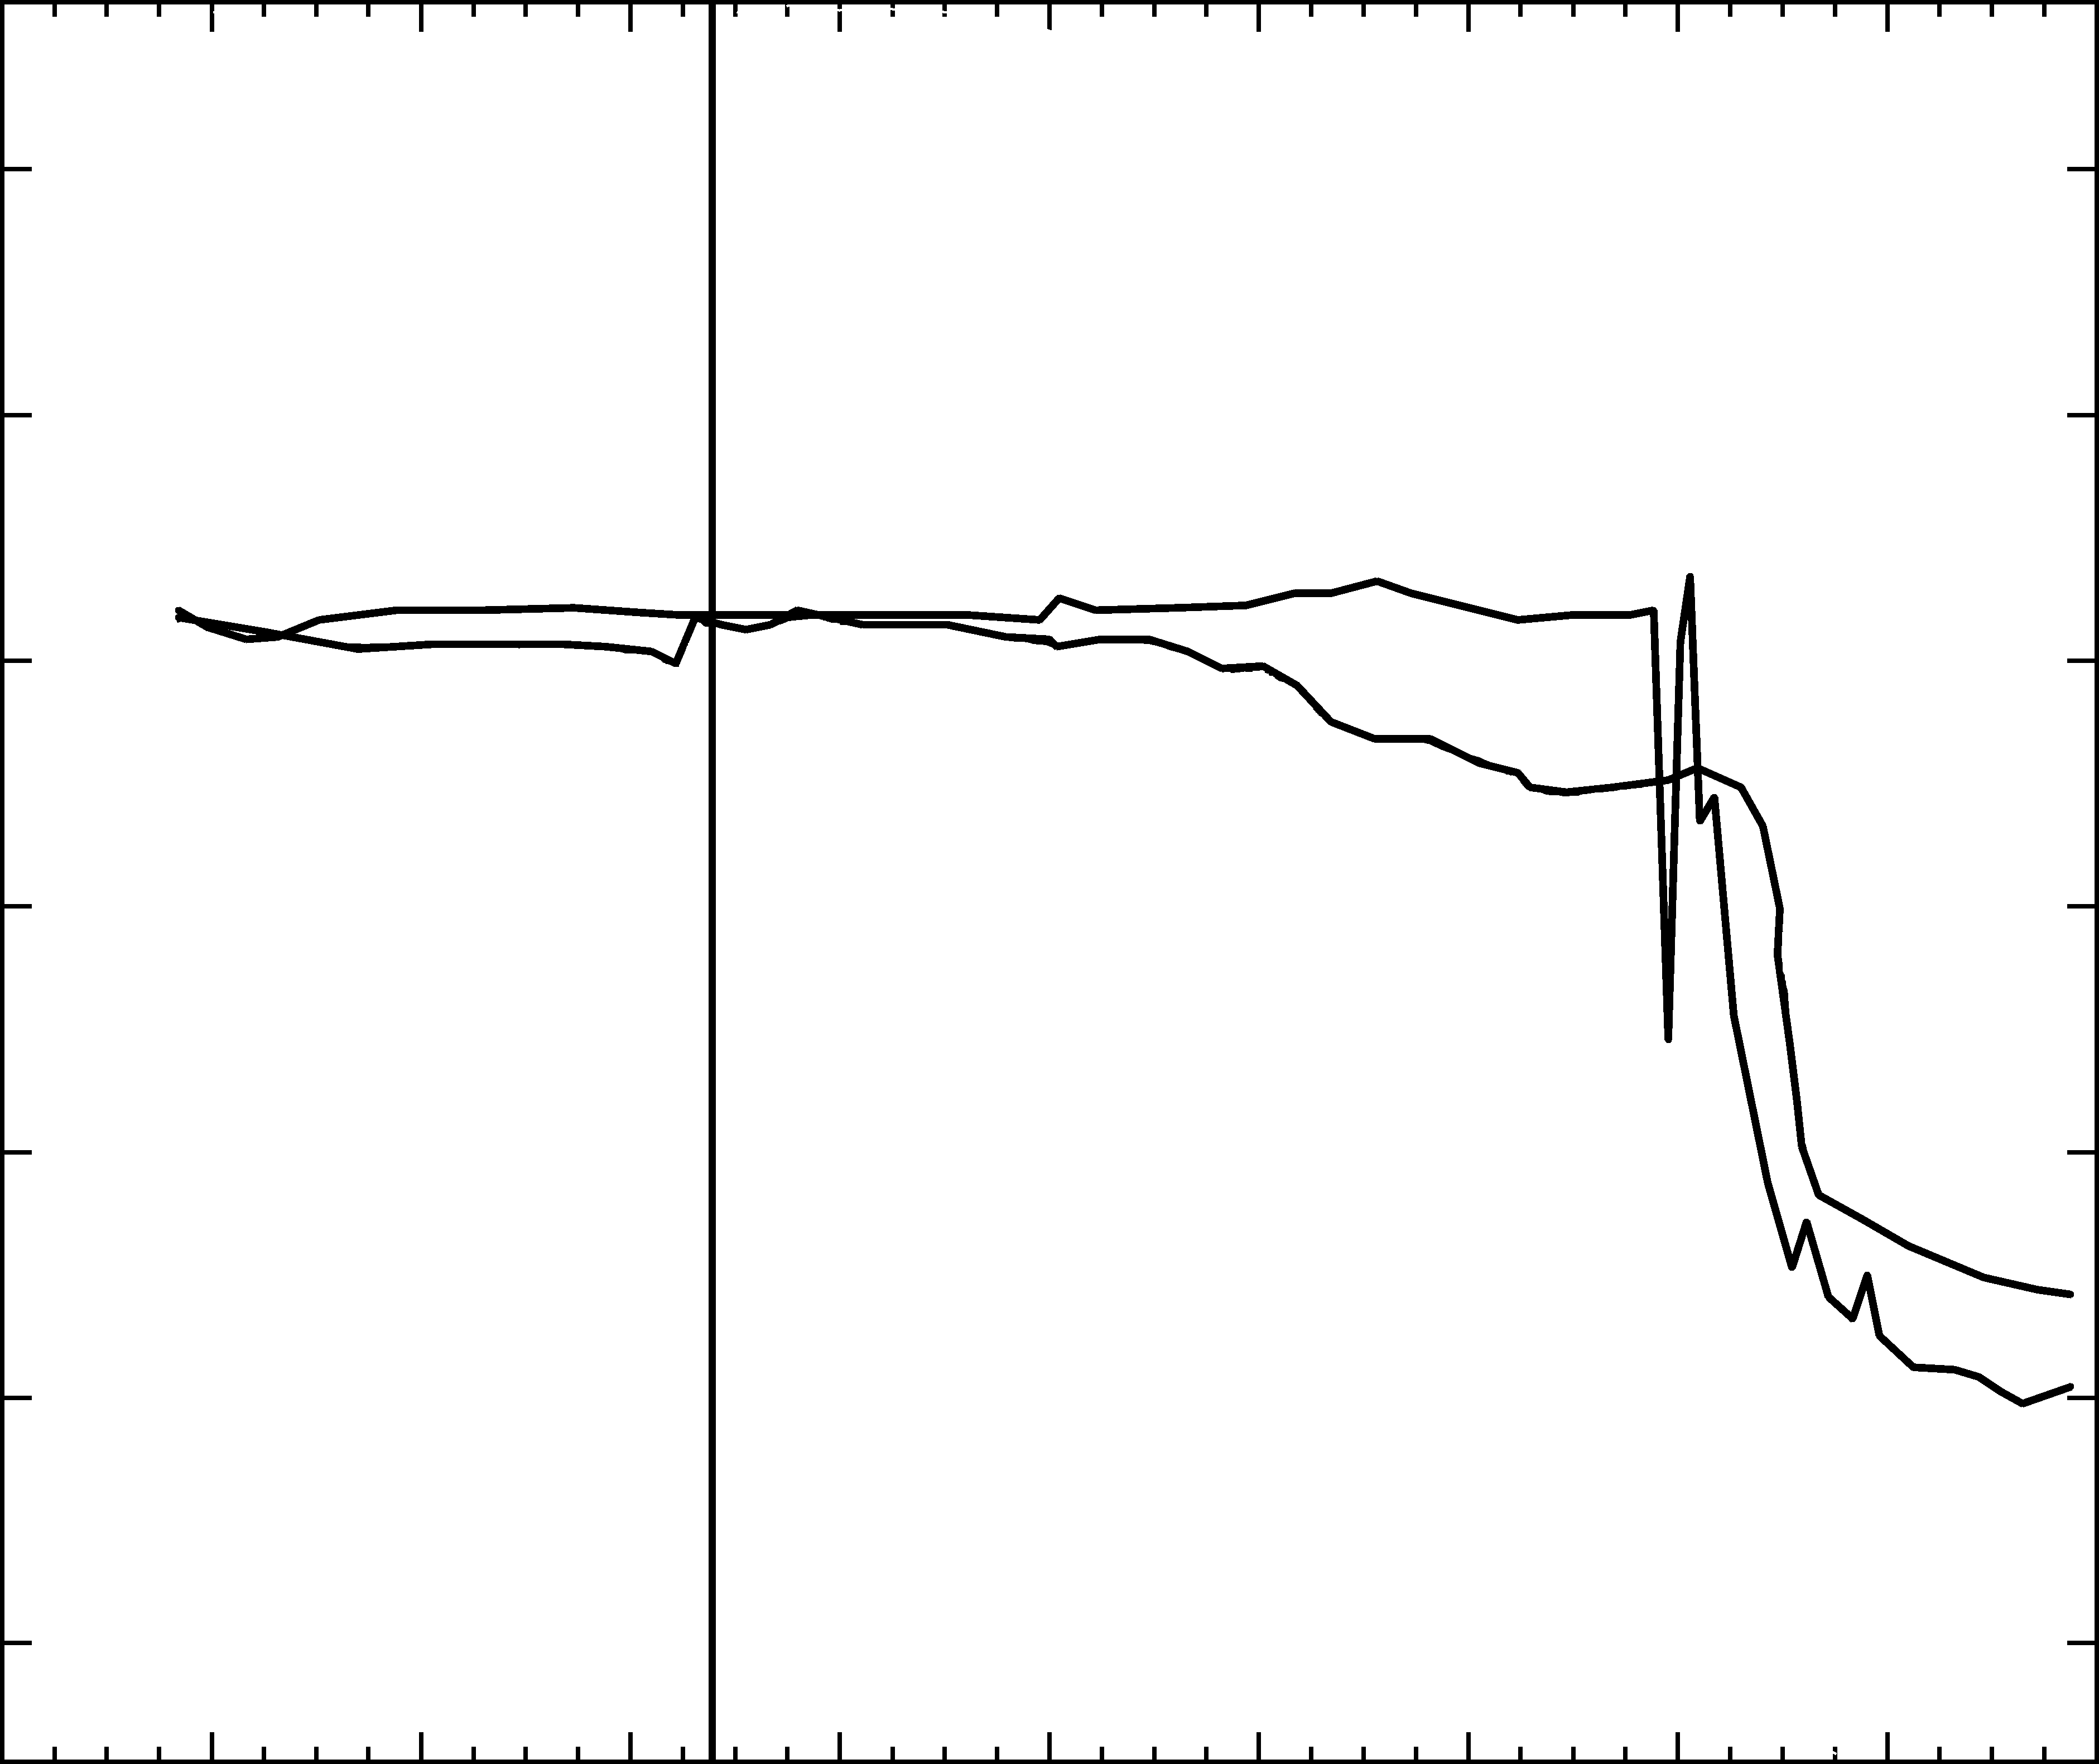
Figure 1: Here we see the actual measurement (spiky curve) versus the model output (smooth curve) over a little history (left of the vertical line) and for the future three days (right of the vertical line). We observe a close correspondence between the measurement and the model. Particularly the event, the sharp drop, is correctly predicted two days in advance.
It is, however, not possible to predict this event any earlier. This is because the model must "see" some change in the system, i.e. the failure mode that eventually leads to the failure must be operating and visible in the data. In general, failure modes that are slower can be predicted longer in advance.
It must be emphasized here that the model can only predict "an event," such as the drop of a measurement. It cannot label this event with the words "blade tear." The identification of an event as a certain type of event is altogether another matter. It is, in principle, possible via the same sort of methods but would require many examples of blade tears and this is a practical difficulty. Thus, the model is capable of giving a specific time when the turbine will suffer a major defect; the nature of the defect must, however, be discovered by manual search on the physical turbine.
But to be truly helpful, we must be able to locate the damage within the large structure of the turbine, so that maintenance personnel will not spend days looking for the proverbial needle in the haystack.
Therefore, fault detection and localization was now done by performing an advanced data-mining methodology (singular spectrum analysis) that tracks frequency distributions of signals over the history and can deduce qualitative changes.
Considering the 80 measurement points, we were able to show that only four of these measurements contained an actual qualitative shift in their history (the others stayed qualitatively the same over the whole history) and that two of these four went through such a shift several days before the other two. Thus, we were able to determine which two out of 80 locations in the turbine were the root cause for the event that was to occur within two days. See figure 2 for an illustration.
In this figure, we graph the abnormality as measured by singular spectrum analysis over time for each measurement. If a system is in some condition for a long time, we may label this condition to be "normal." If this condition changes, we can call it "abnormal." When the abnormality persists, however, this new condition eventually becomes normal by virtue of the definition of normality as being that condition that has been current for a long time. When a system makes a qualitative transformation from one persistent state to another, we would therefore expect any reasonable abnormality measure to first increase (upon the change) and then decrease again (as the new state becomes increasingly normal).
What we observe from figure 2 is that two of the measurements become abnormal early in time and two others follow suit. When we asked which time-series these were, we found that the first two were the radial and axial vibrations of one bearing, and the second two were the same vibrations of the neighboring bearing. Of course, we cannot be certain that there exists a physical cause-effect relationship between these three events: (1) first bearing changing its vibration behavior, (2) second bearing changing its vibration behavior, and (3) blade tear. The available data strongly suggests this link however. Indeed, the blade that tore off was very close to the first bearing that changed its vibration behavior. Thus we were successful in localizing the fault within the large turbine.
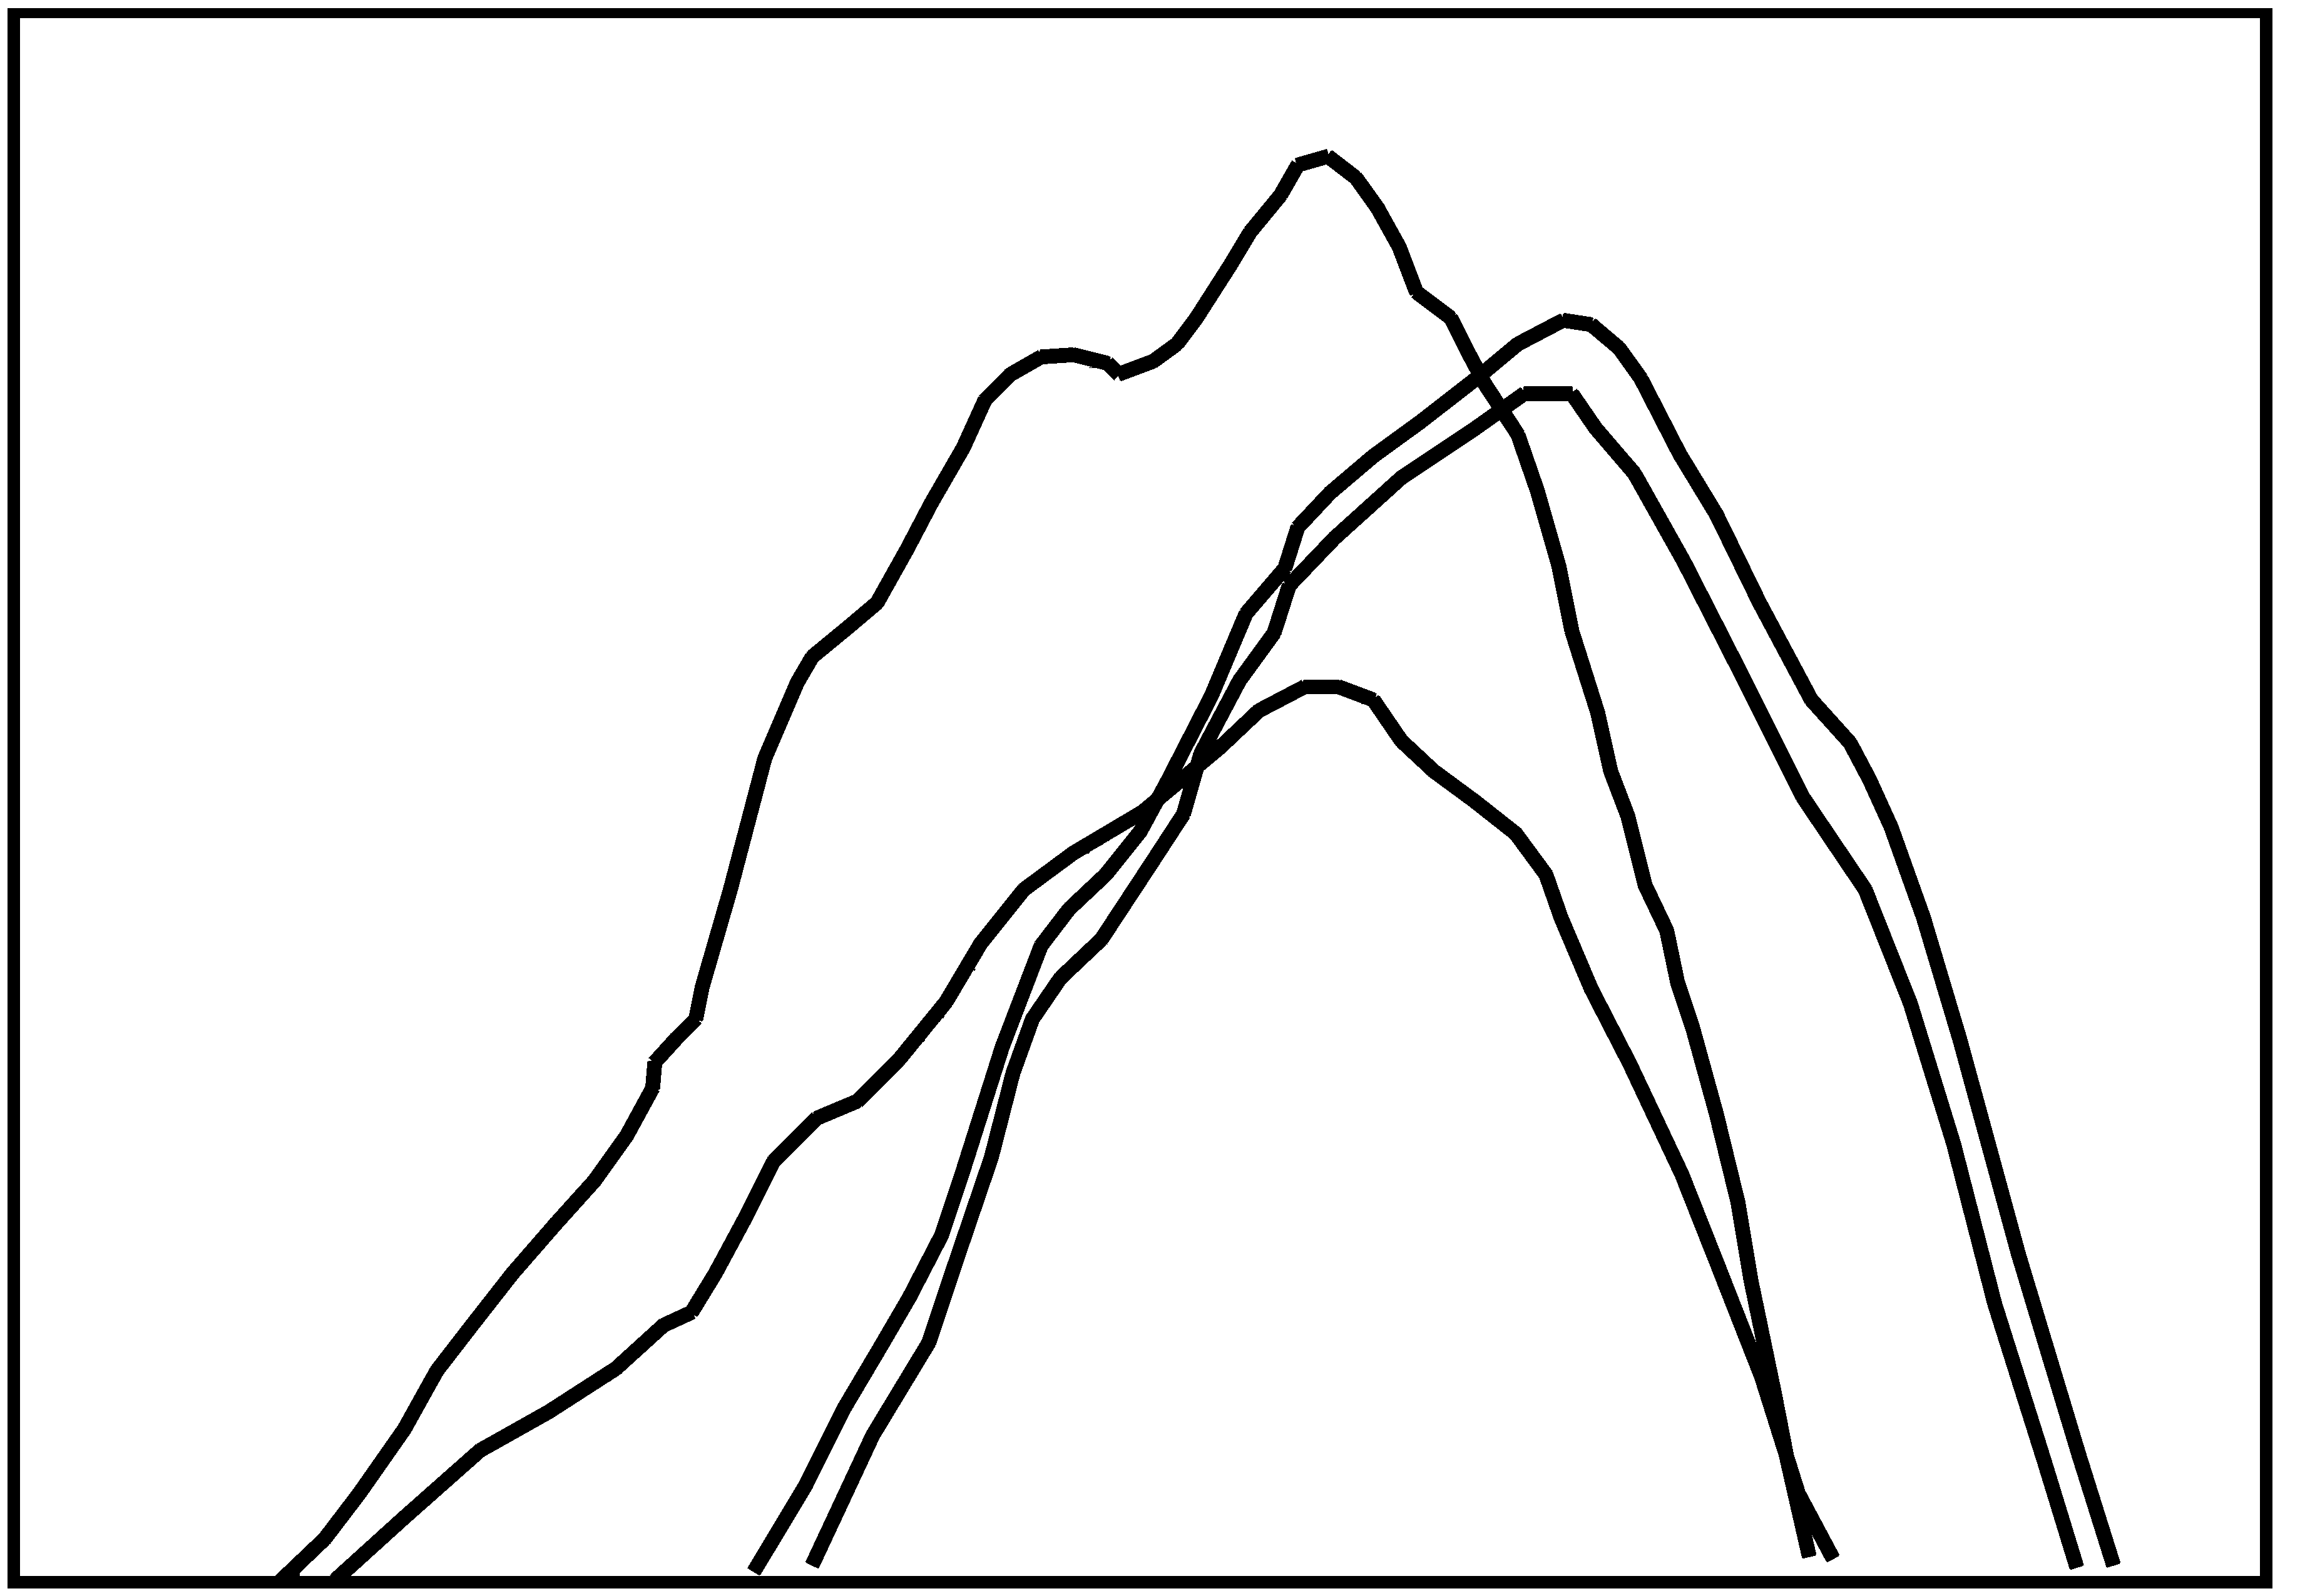
Figure 2: We compute a deviation from normal being tracked over a window of about four days in length. So we observe that two sensors start behaving abnormally and two days later, two other sensors behave abnormally. About 3.5 days after the start of the abnormal behavior, this new behavior has become normal and so the deviation from normal is seen to reduce again. Therefore, we observe a qualitative change in the performance of these four points.
It is possible to reliably and accurately predict a failure on a steam turbine two days in advance. Furthermore, it is possible to locate the cause of this event within the turbine so that the location covered by the sensor that measures the anomaly can be focused on by the maintenance personnel. The combination of these two results, allows preventative maintenance on a turbine to be performed in a real industrial setting saving the operator a great expense.


