Scrap Detection in Injection Molding Manufacturing

Pablo Cajaraville (Reiner Microtek), Björn Dormann (Klöckner Desma Schuhmaschinen GmbH), Dr. Philipp Imgrund (Fraunhofer Institute IFAM), Maik Köhler (Klöckner Desma Schuhmaschinen GmbH), Lutz Kramer (Fraunhofer Institute IFAM), Oscar Lopez (MIM TECH ALFA, S.L.), Kaline Pagnan Furlan (Fraunhofer Institute IFAM), Pedro Rodriguez (MIM TECH ALFA, S.L.), Dr. Natalie Salk (PolyMIM GmbH), Jörg Volkert (Fraunhofer Institute IFAM), Dr. Patrick Bangert (algorithmica technologies GmbH)
The injection molding technology is a widely used technology for the mass production of components with complex geometries. Almost any material can be processed with this technology. For polymers the pelletized/fragmentedmaterial is injected into a hollow mold cavity (showing the negative structure of the resulting part) and then molded under elevated temperature. The part is cooled down and ejected.
In the case of metals and ceramics the so called metal injection molding (MIM) or ceramic injection molding (CIM) process is applied. Both processes fall under the umbrella term powder injection molding (PIM). In all these cases, the material powder is mixed with a binder composed of polymers and/or waxes. This so-called feedstock is subsequently injected into a mold. The ejected parts are called green parts because they still contain the binder material that acted as flowing agent during the injection molding process. To remove the binder, the components have to be debinded in a solvent or water solution for a certain amount of time. Subsequently, an additional thermal debinding step is needed to decompose the residual binder which is to act as backbone of the resulting, still fragile and porous part that is now called the brown part. That part is in a condition requiring the metal to be condensed in a furnace process called sintering. During the sintering step, the parts are heated up to approximately ¾th of the melting point of the integrated material powder. During the sintering process the material densifies to a full metallic or ceramic part, showing the same material properties as parts made using classic metalworking methods. An example of the result is illustrated in figure 1 [1].
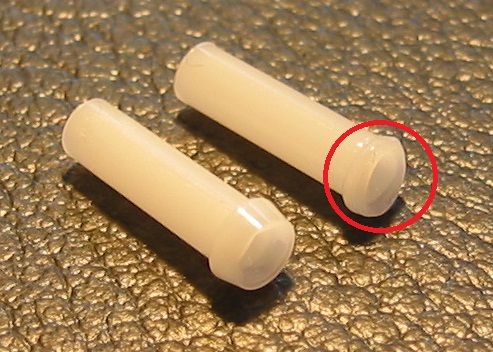
Figure 1: The image displays a good part and a damaged part. The left part is as it should be and the right part is damaged.
Often, the damages to a part, that occur during injection, can only been seen on the final product. As the steps of debinding and sintering have expended significant amounts of electrical energy, the process has rendered the material useless. If we could identify a damaged part already during its green stage, we could recycle that material and also save the energy for debinding and sintering. Also, for all parts, there is an effort involved in determining whether the part is good or not. Today, this effort is usually made manually, which is expensive. If we could make the identification automatic, we would save this effort as well.
An injection molding machine is monitored and controlled by manually inputting a series of values known as set-points. These are the values for various physical quantities that we desire to have during the injection process. It is the responsibility of the machine to attempt to implement these set-points in the actual operation. This attempt is generally achieved but there are deviations in the details. In order to monitor what the actual values of these various measurements are, an injection machine will also have sensors that output these measurements over time, i.e. a time-series.
For each part produced, we thus have the set-points and also a variety of measured time-series over the duration of its injection. This information is available in order to characterize a part. In order to achieve the goal of identifying scrap parts earlier in the process, we could make use of all the measured time-series of all the sensors. However, that would require an enormous amount of computer capacities and would also require many parts to be produced. As this is unrealistic for all practical purposes, we must live with a few hundred training parts and must keep the number of variables as small as possible. After many trials with various settings, we have found the best performance with the following procedure (see figure 2 for an example):
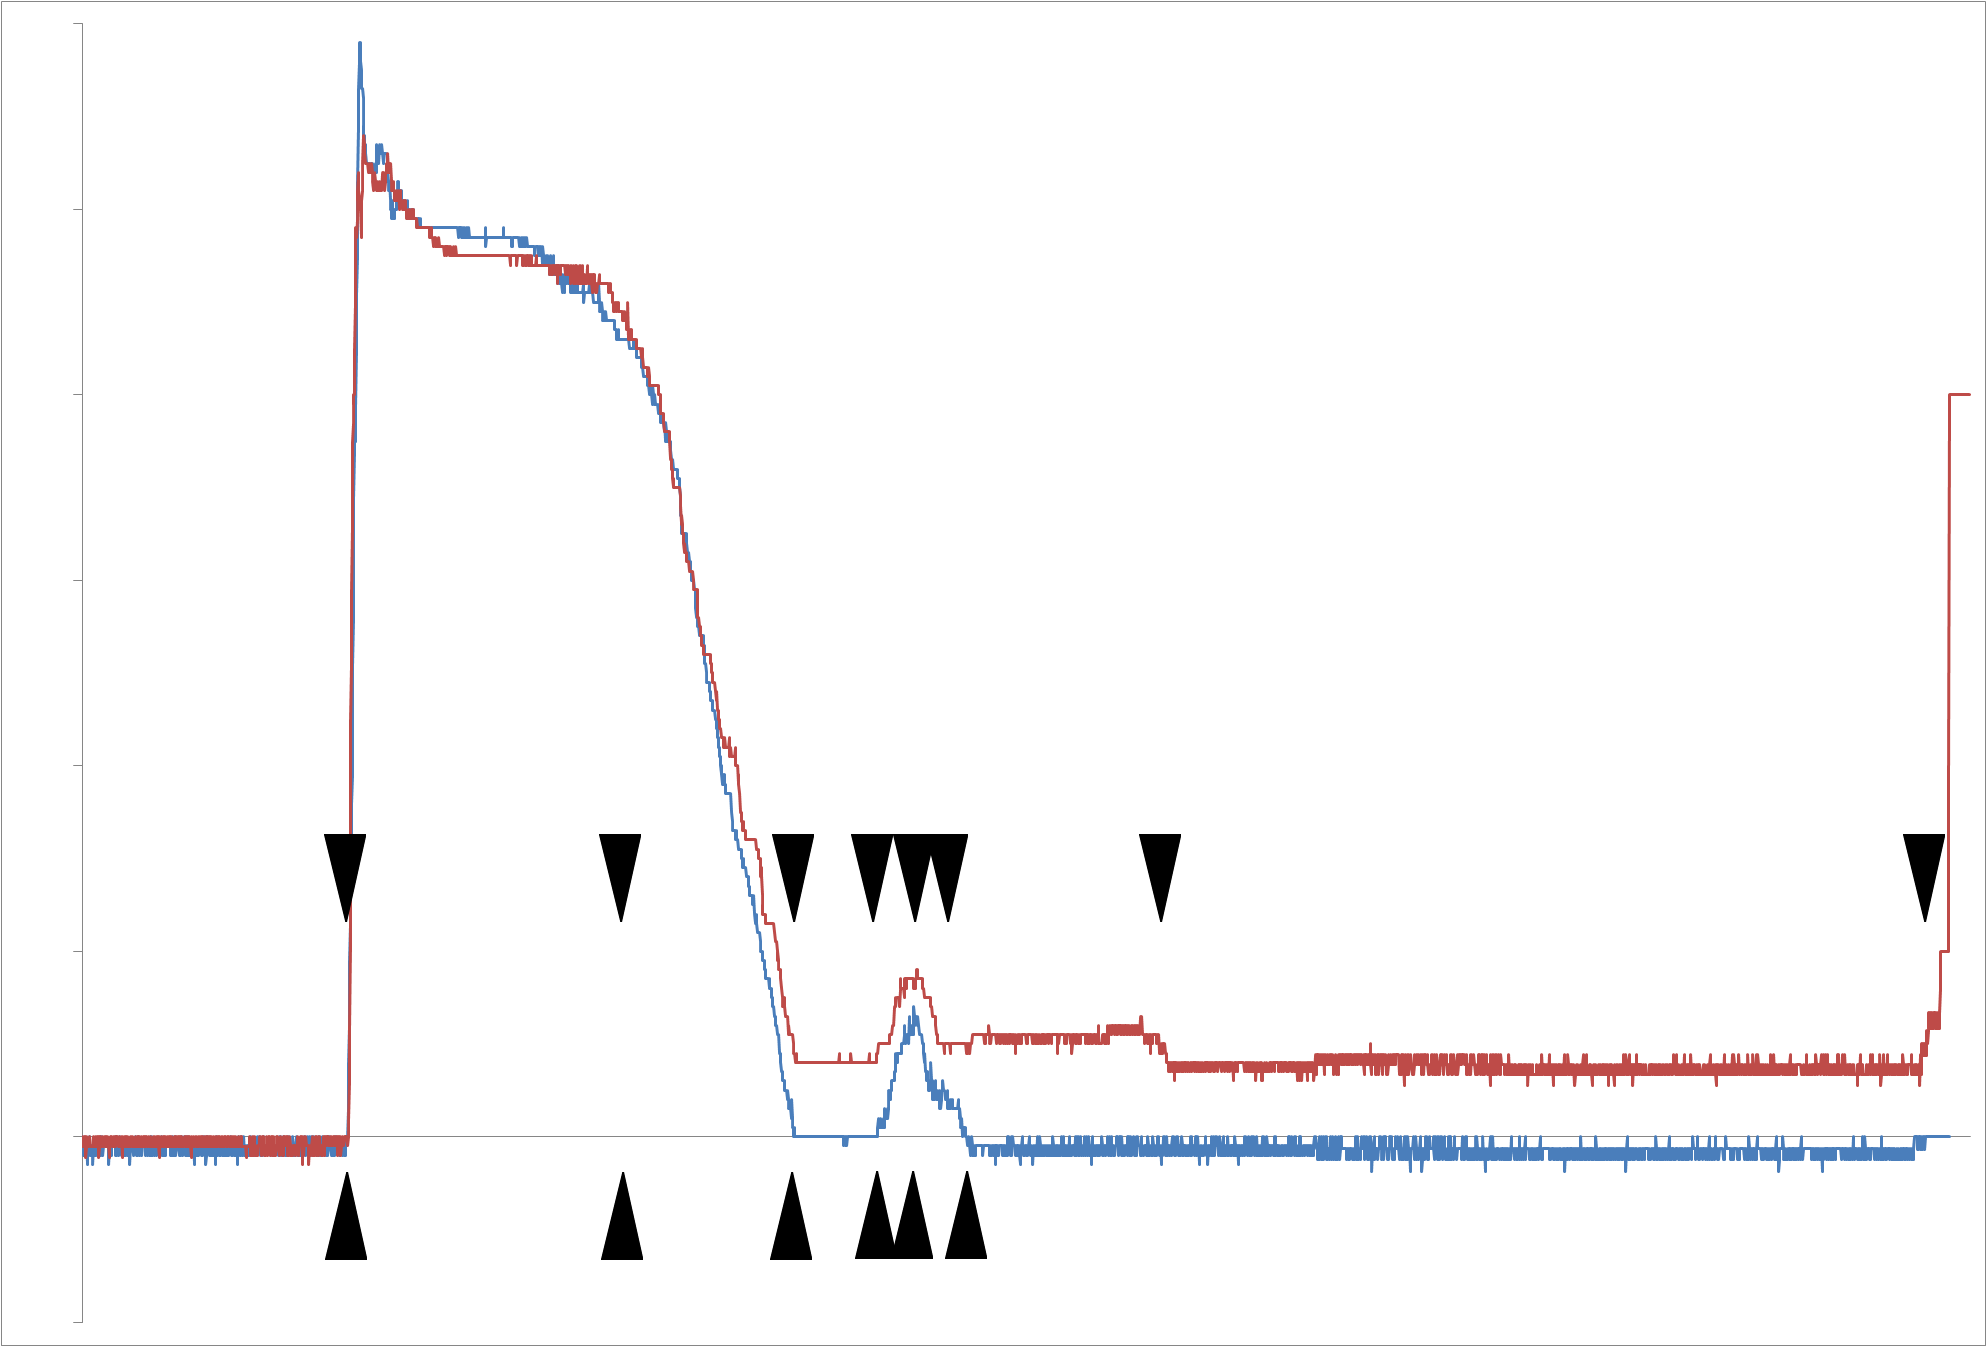
Figure 2: The bottom blue curve is the average pressure observed at the nozzle averaged over all parts known to be good. The top red curve is a single observation of a part known to be bad. The black arrows pointing up indicate the position of the turning points of the bottom curve and the black arrows pointing down indicate the position of the turning points of the top curve. We observe that the top curve has two extra turning points. We also observe that the height of the blue and red curves at these points differ.
In order to model the question of what distinguishes a bad part from a good part we must collect samples of these salient features and the quality output. To do this, we must manually assess a number of injected parts and characterize them as scrap or good. We have determined that a good number of observations is 500 or more. While making these 500 trial parts, it is good to modify the set-points every so often.
After this initial phase, when a new part is injected, its salient features are now used by the model to determine if the part is good or bad. As a result a robot can be triggered to remove the scrap parts from further production.
Even if we are able to correctly identify every part as either good or bad, this will not change the amount of scrap actually produced -- it will merely change the amount of scrap delivered to the customer. In order to reduce the amount of scrap actually produced, we must interact with the production process actively via the set-points. We do this by computing the value for each set-point such that the false-positives rate (the relative number of actual scrap parts identified as good parts) is minimized.
These methods were tried on several parts including metallic, ceramic and plastic parts using injection molding machines of different manufacturers. For each kind of part, a total of 500 parts were made, with various settings of the set-points, of which approximately 20% were scrap. This high scrap rate results from the various set-points settings, some of which are, of course, not optimal.
We find that the recognition efficiency is 98% in that we recognize good and bad parts correctly. The false positive rate is 0.002 in that scrap parts are recognized as good. Relative to our sample size of 500, this means that only a single scrap part was not recognized as such. The false negative rate in which good parts are recognized as scrap was 0.018, which means 9 parts in total.
Recall that the objective was to minimize the false positive rate. It is clear that this cannot be reliably zero and so getting a rate of one part in 500 can be interpreted as a success. The system is certainly more reliable than manual quality control, which is common in the industry.
The actual production scrap rate was approximately 20%. This could have been reduced to 5% by adjusting the set-points appropriately. Of course, a real production will not be at the level of 20% scrap and so an improvement of a factor of four seems unlikely. Nevertheless, a significant factor should be possible.
Now that we have verified that it is possible to reliably identify scrap from good parts based only on process data and that we can optimize the process based on the same analysis, we ask what the practical significance of this is. There are two major points: Quality improvement and energy savings.
With respect to quality improvement, there are also two aspects.
First, the quality of the delivered product. Even if we produce 20% scrap, 98% of these are correctly recognized to be scrap and so these are not delivered to the client. Looking at the current numbers, then, we produce 500 parts all in all. Of these, we have 100 scrap parts. We recognize 98 scrap parts as scrap, 392 good parts as good, 9 good parts as scrap and one scrap part as good. Thus the client receives 392 good parts and one scrap part in the delivery. This is an effective scrap rate -- with the client -- of 0.3%. The identification was thus able to lower the production scrap rate of 20% to a delivery scrap rate of 0.3%.
Second, the production quality will also improve due to the optimization. Since we can lower the production scrap rate of 20% to 5%, we would produce 475 good parts and 25 scrap parts as compared to the above figures. In final consequence, the client would receive 466 parts of which one would be scrap. This lowers the effective delivery scrap rate to 0.2% and relative to a larger delivery size. With the optimization, the molding production cost per delivered part is lowered by 19%. This is a reduction in production cost that is otherwise unreachable.
With respect to energy savings, we also save the energy costs that would have flown into the steps of debinding and sintering of parts that later are recognized as scrap. It is hard to quantify this in any general manner but we assume that this lowers the total production cost per delivered part by another 4%.
We gratefully acknowledge the partial funding of this research by the European Union: Investment in your future -- European fund for regional development, the EU programs MANUNET and ERANET, the German ministry for education and research (BMBF) and the Wirtschaftsförderung Bremen (economic development agency of the city state of Bremen, Germany).


